Highlights
As code flows through your CI workflows, it is processed by plenty of different steps. Each step depends on various configuration and parts that change frequently. Even though your pipeline has a solid setup, it may slow you down while identifying the problems during you deploy to the production.
A common challenge for software organizations is ensuring that all stakeholders — developers, DevOps engineers, SREs — have across-the-board visibility into the software delivery process. The reason you need workflow analytics is to identify issues and enhance organization-wide visibilty on your workflows.
Foresight allows you to identify those in the most quick way to enable you to have better workflow operations.
Watch quick introduction to Foresight Highlights:
Organization-wide CI Analytics
Quick actions
The quick actions section is the fastest way to go to your failed and problematic latest run. Get notified about your latest run's status. Also, you can see the number of workflow runs in total in your organization. With that information, you can overview the CI performance of your whole organization.

Status
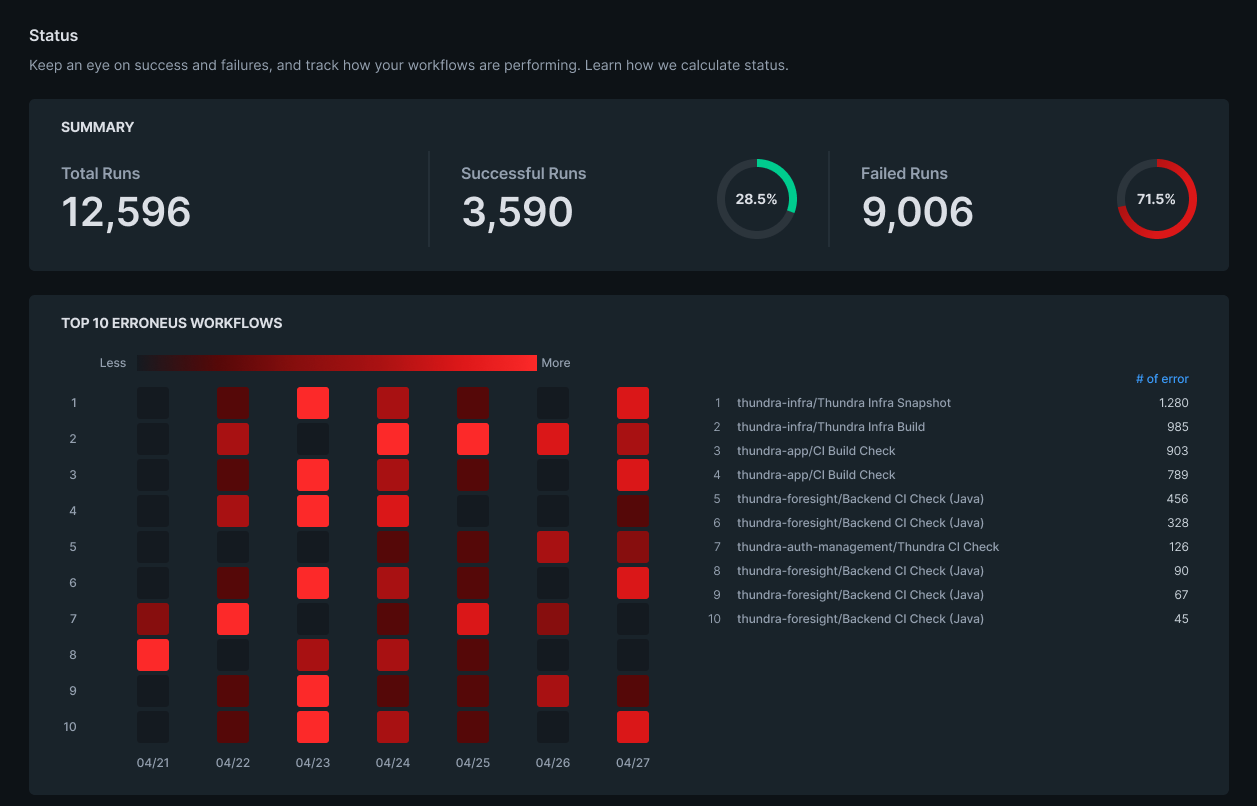
Status section helps you to keep an eye on success and failures, and track how your workflows are performing. Foresight gathers your workflow runs an groups them according to the success, failure and other status information by their dates.
Foresight uses heatmap to visualize your failure trend. Foresight groups failed runs by their execution dates and shows workflow behavior.
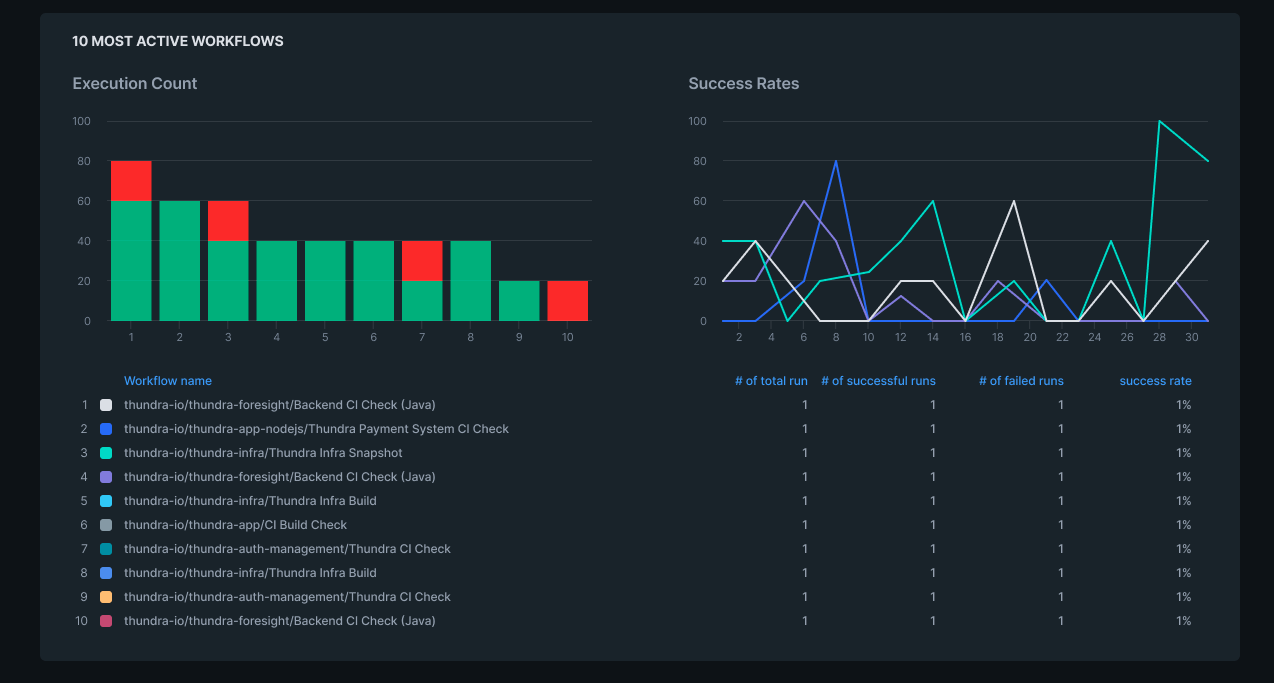
You may have numerous workflows, however, the ones you should start to look is the most active ones. Foresight sorts the most active workflows by their execution configurations during the selected period, and shows the distribution of success and failure status of the runs.
Cost
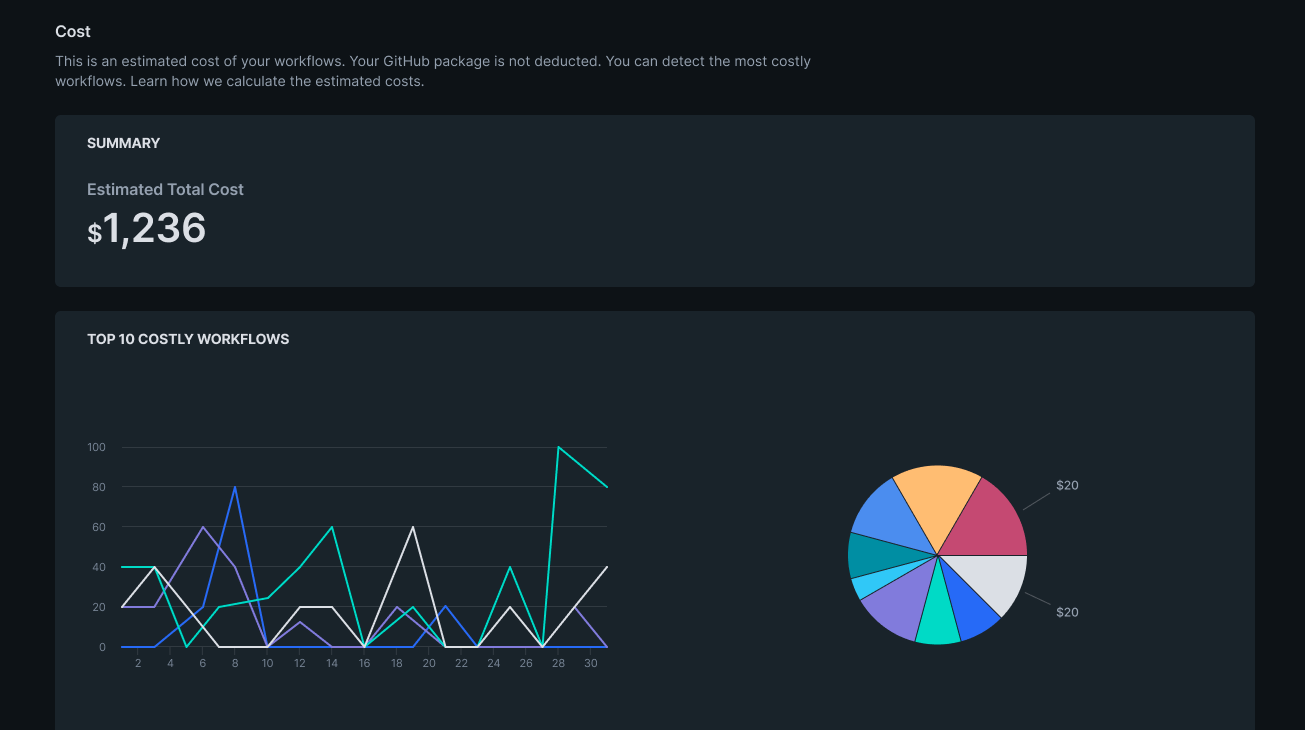
This is an estimated cost of your workflows. You can detect the most costly workflows.
After gathering your workflow run metadata, Foresight combines those information with GitHub's pricing plan.
Your GitHub package is not deducted. This is not the billable cost information and it is not official. We only estimate the cost of the workflow. Your real monthly-bill may be different.
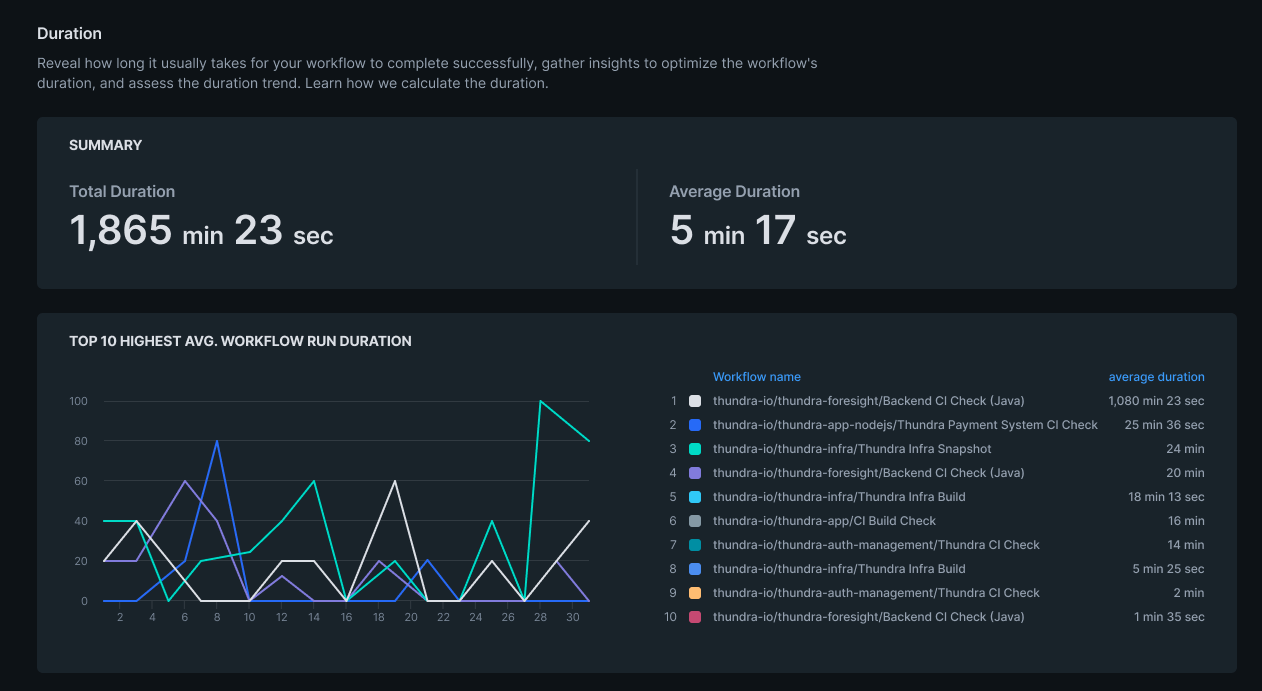
Duration
Reveal how long it usually takes for your workflow to complete successfully, gather insights to optimize the workflow's duration, and assess the duration trend. Learn how we calculate the duration.
Average duration is calculated among the successful workflow runs. Statuses other than successful runs may take less or longer than the expected. Therefore they are not inclued.
Singe workflow highlights
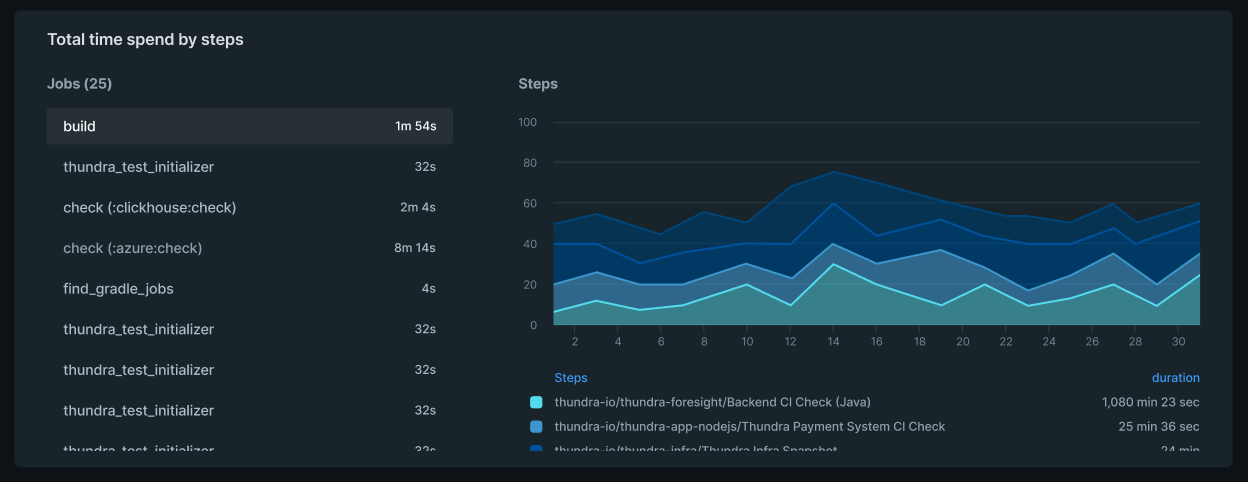
After clicking on the workflows on the general highlights screen, you can see the individual workflow highlights. Apart from the metrics above, individual highlight includes Step statistics.
Total time spend by step chart gives you the ability to detect which step is allocate too much among your whole job.
Statuses other than successful runs are not inclued.
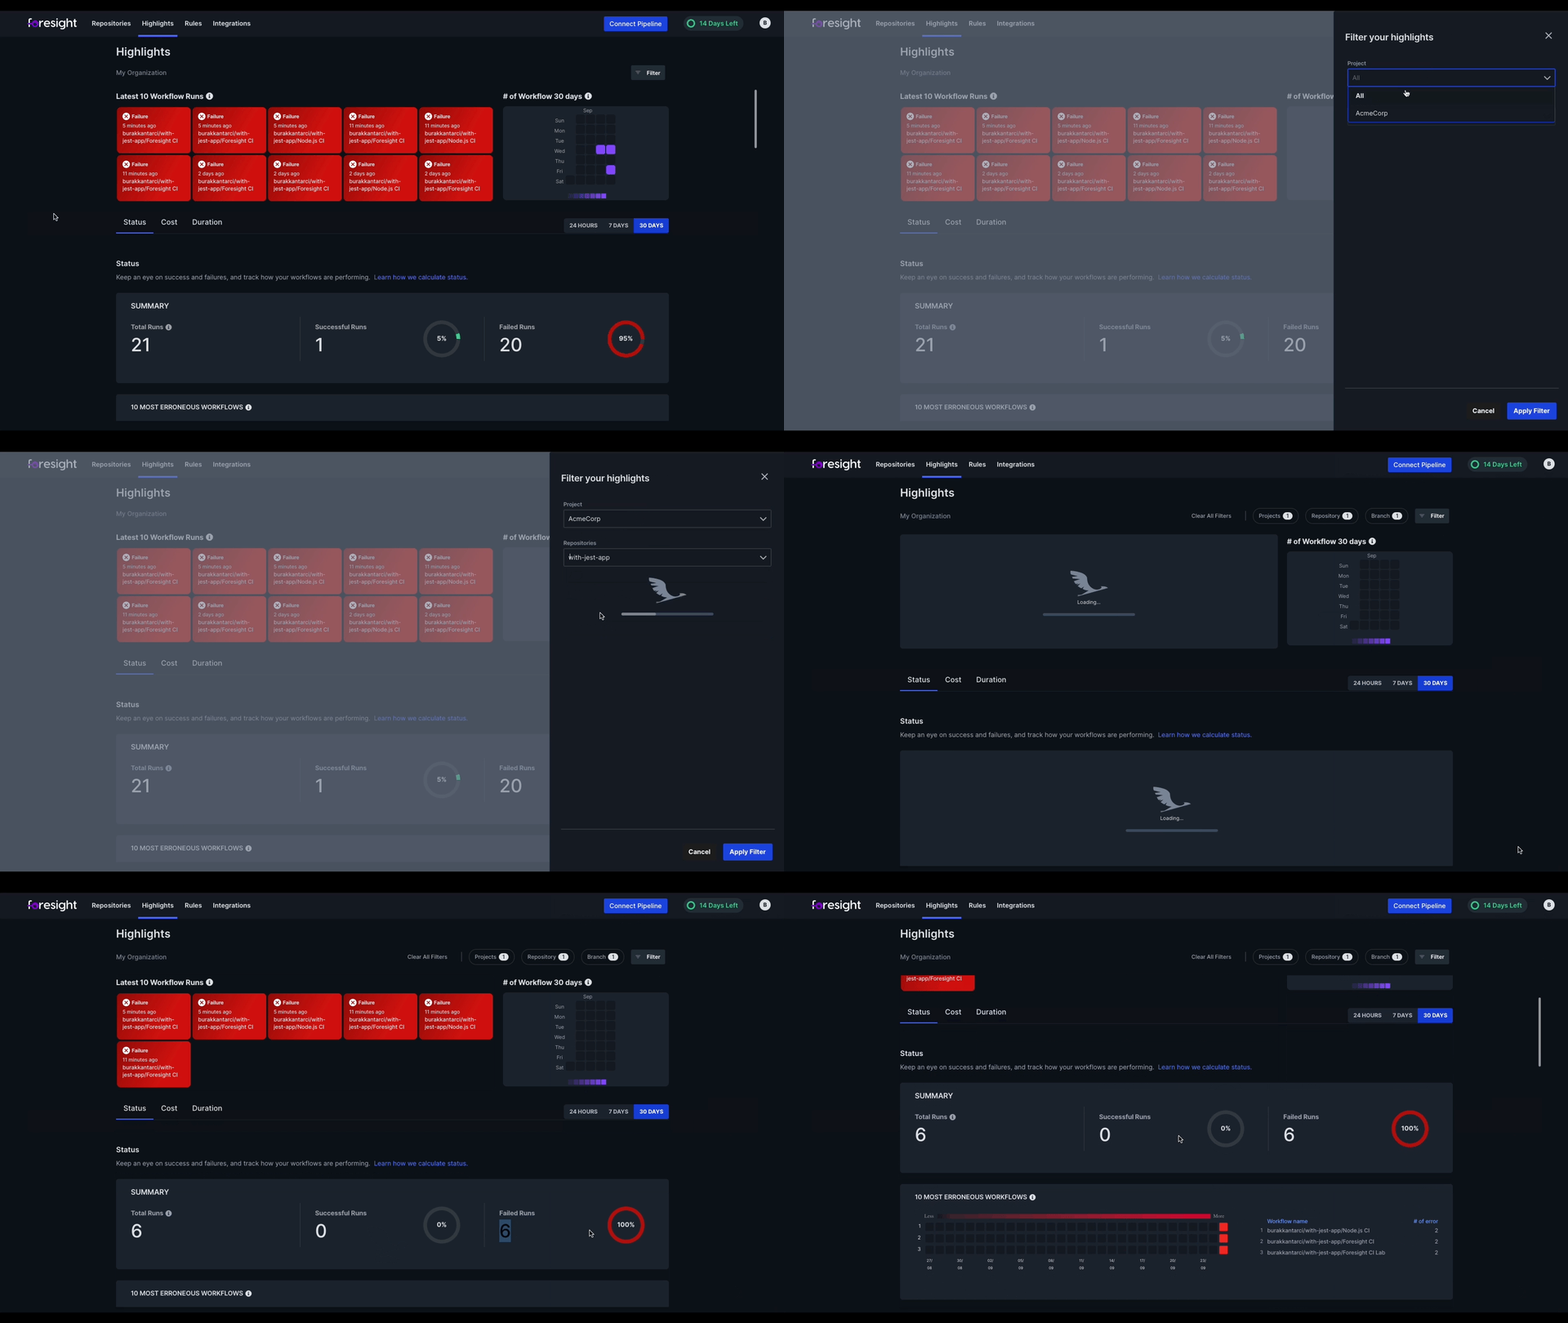
Filtering highlights
Use filters to see the metrics the matters the most. You can filter by:
- Project
- Repository
- Branch
