Grafana GitHub Actions Dashboard

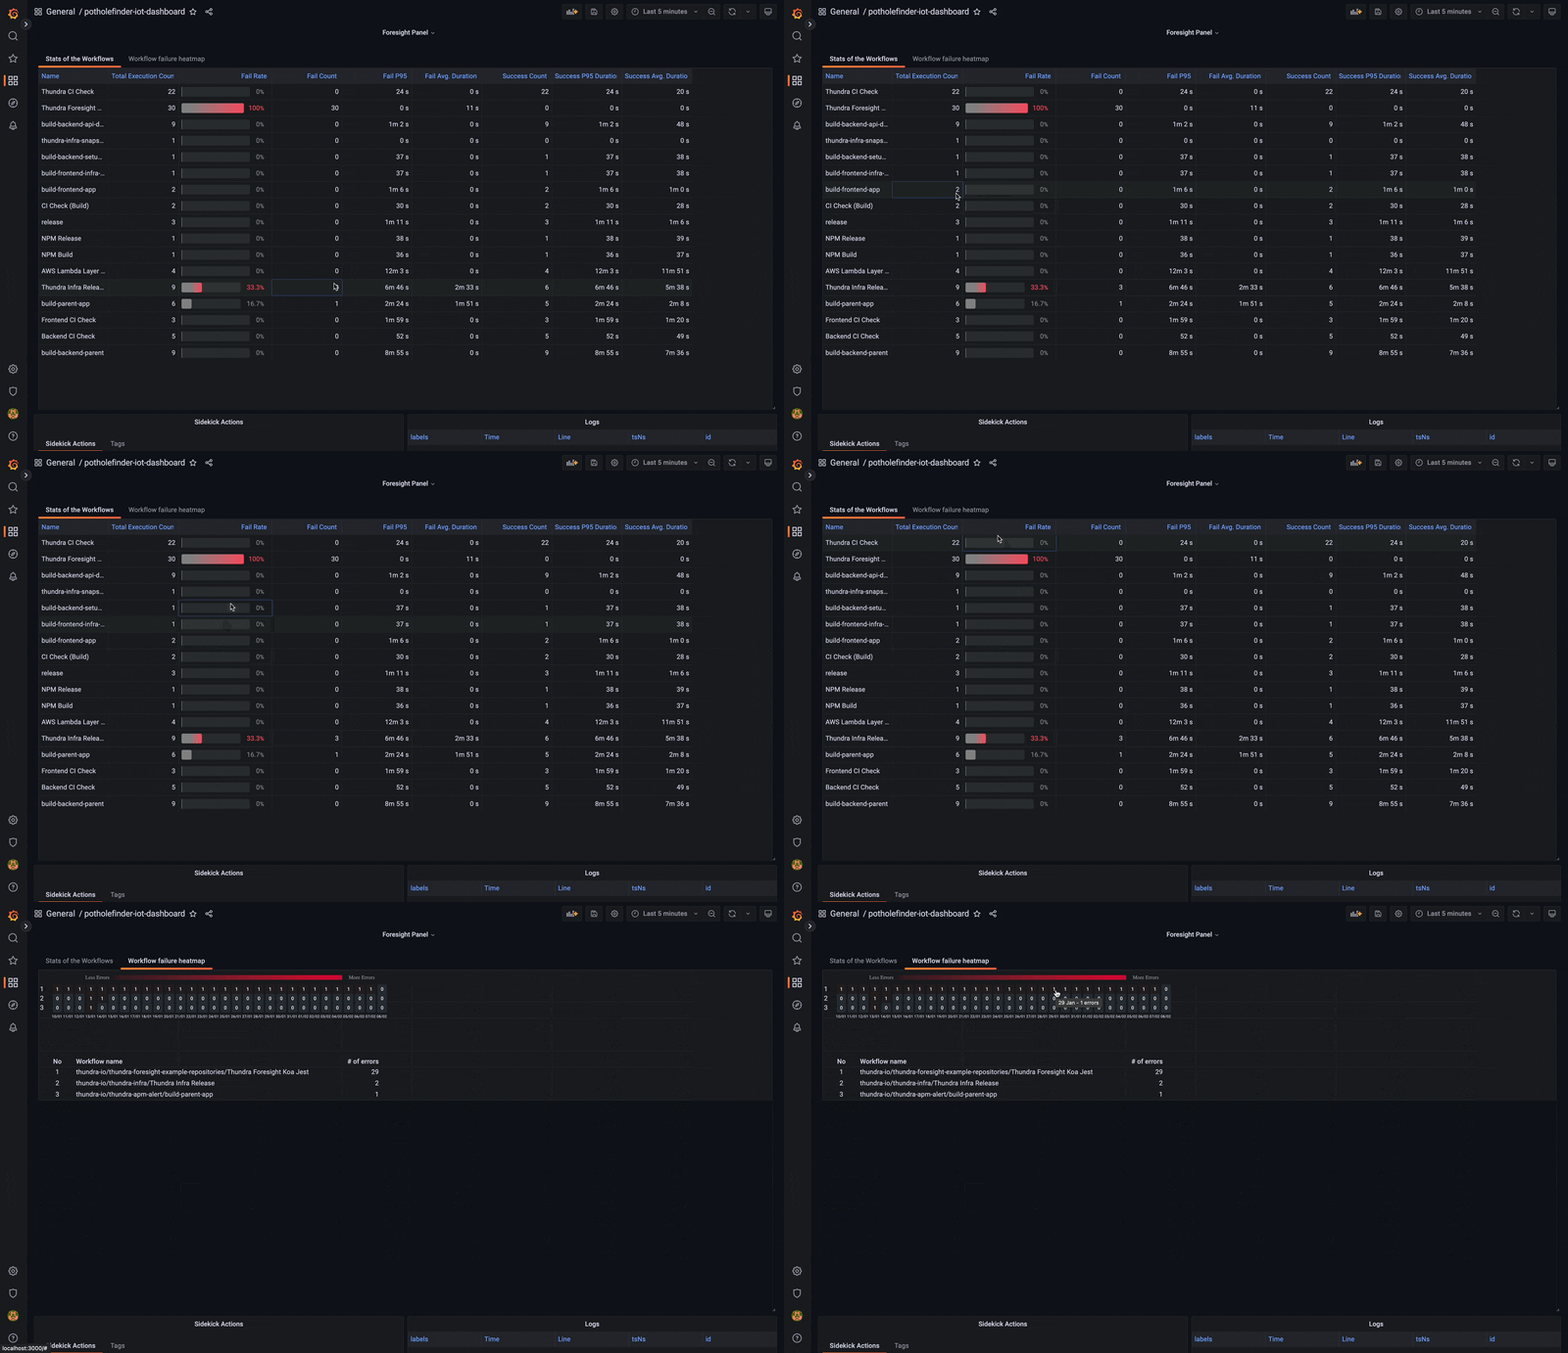
Foresight panel plugin lets you to bring Foresight features to Grafana.
This panel includes information about:
- Total execution count
- Fail & Success Rate
- Fail count
- Average Duration
- P95
- number of errors per day & workflow
info
Many more features are on the way, and your feedback is highly appreciated.
This plugin is unsigned and requires steps below to setup.
2
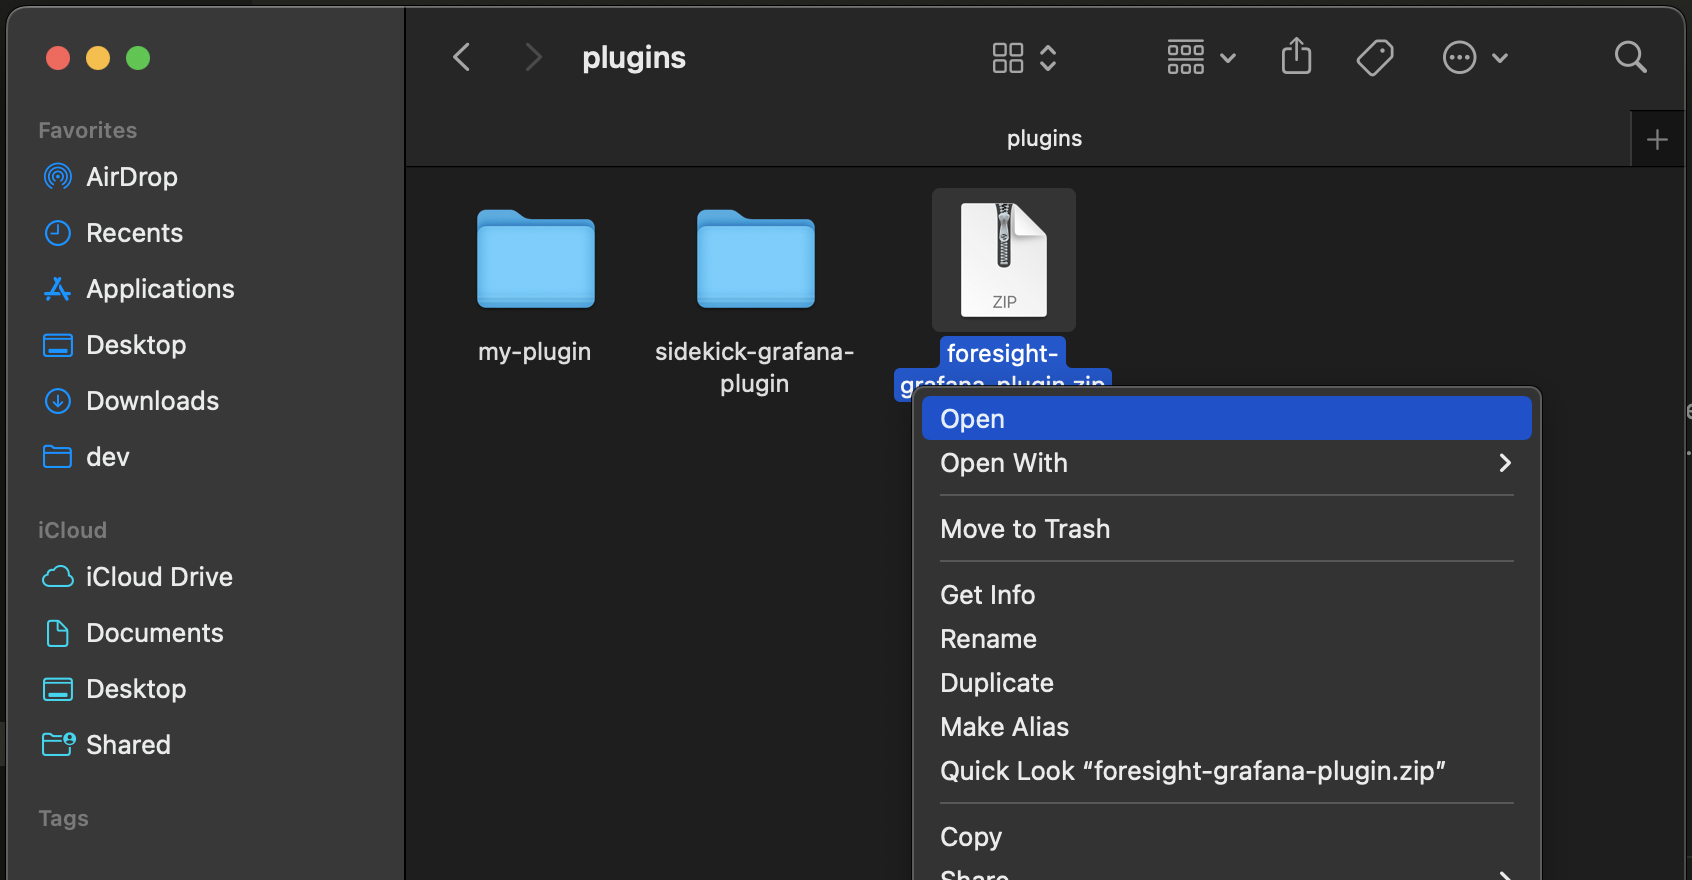
Copy zip file and unzip under grafana/data/plugins folder

3
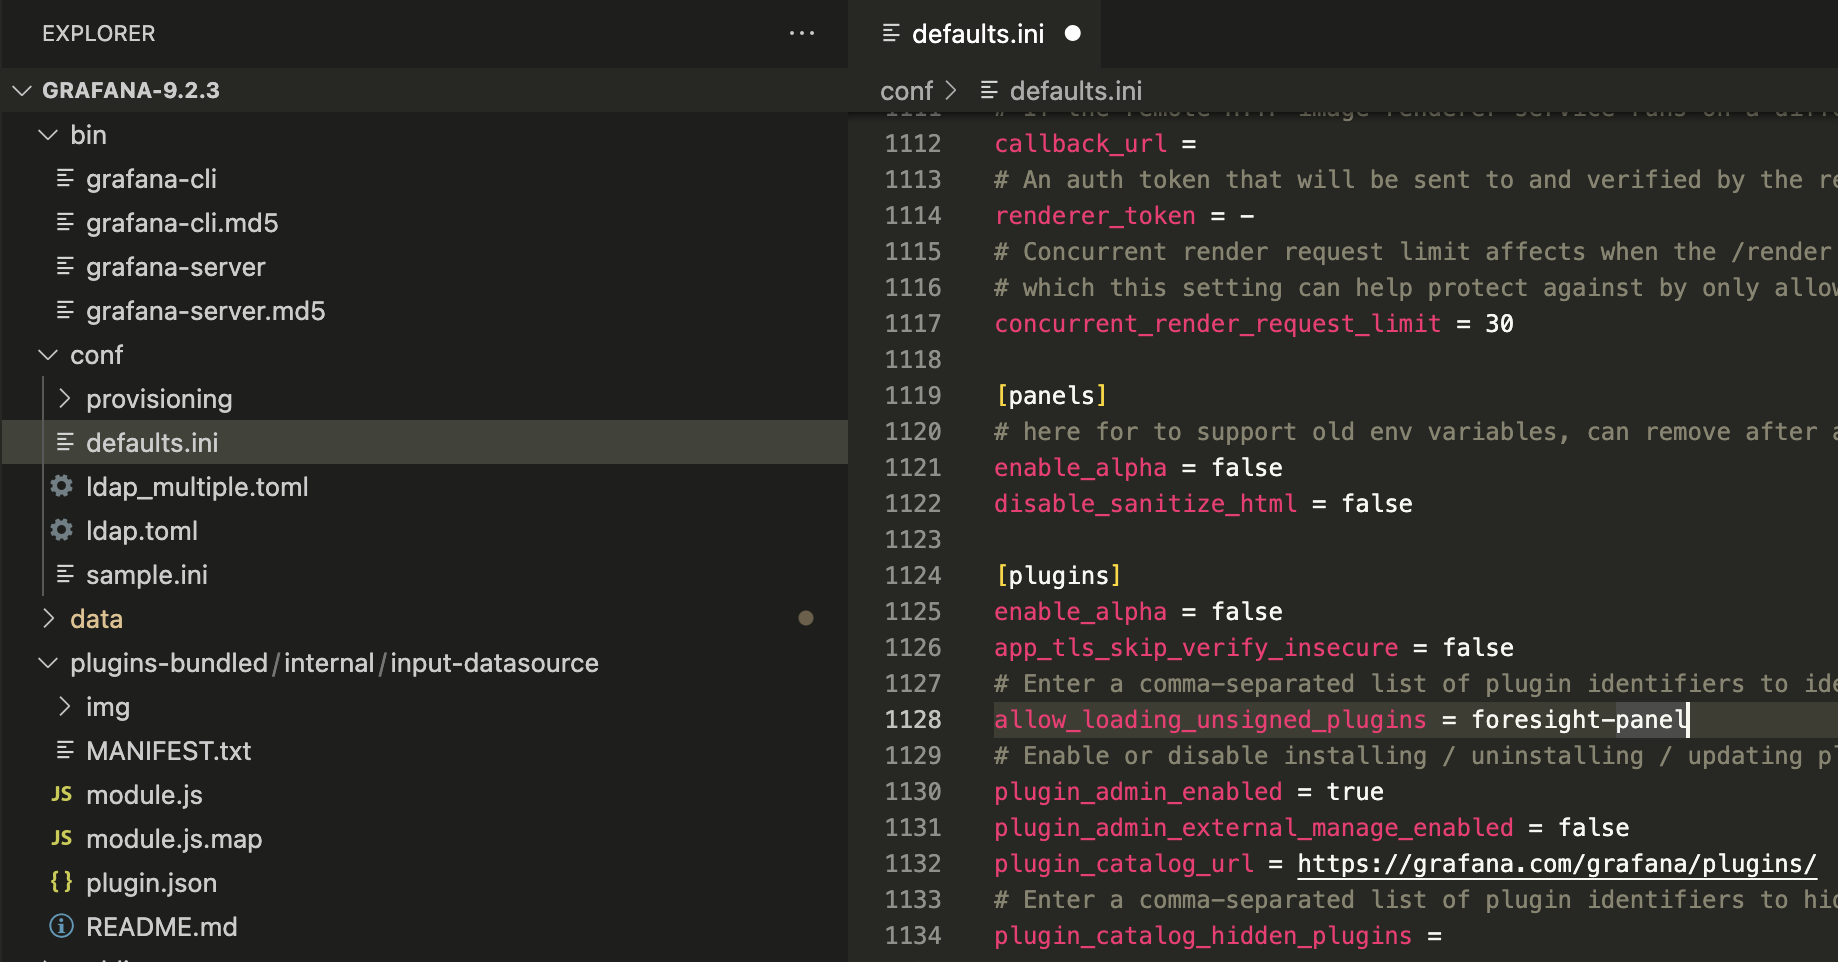
Edit defaults.ini and add foresight-panel to allowed plugins list
Restart Grafana after this process.
5
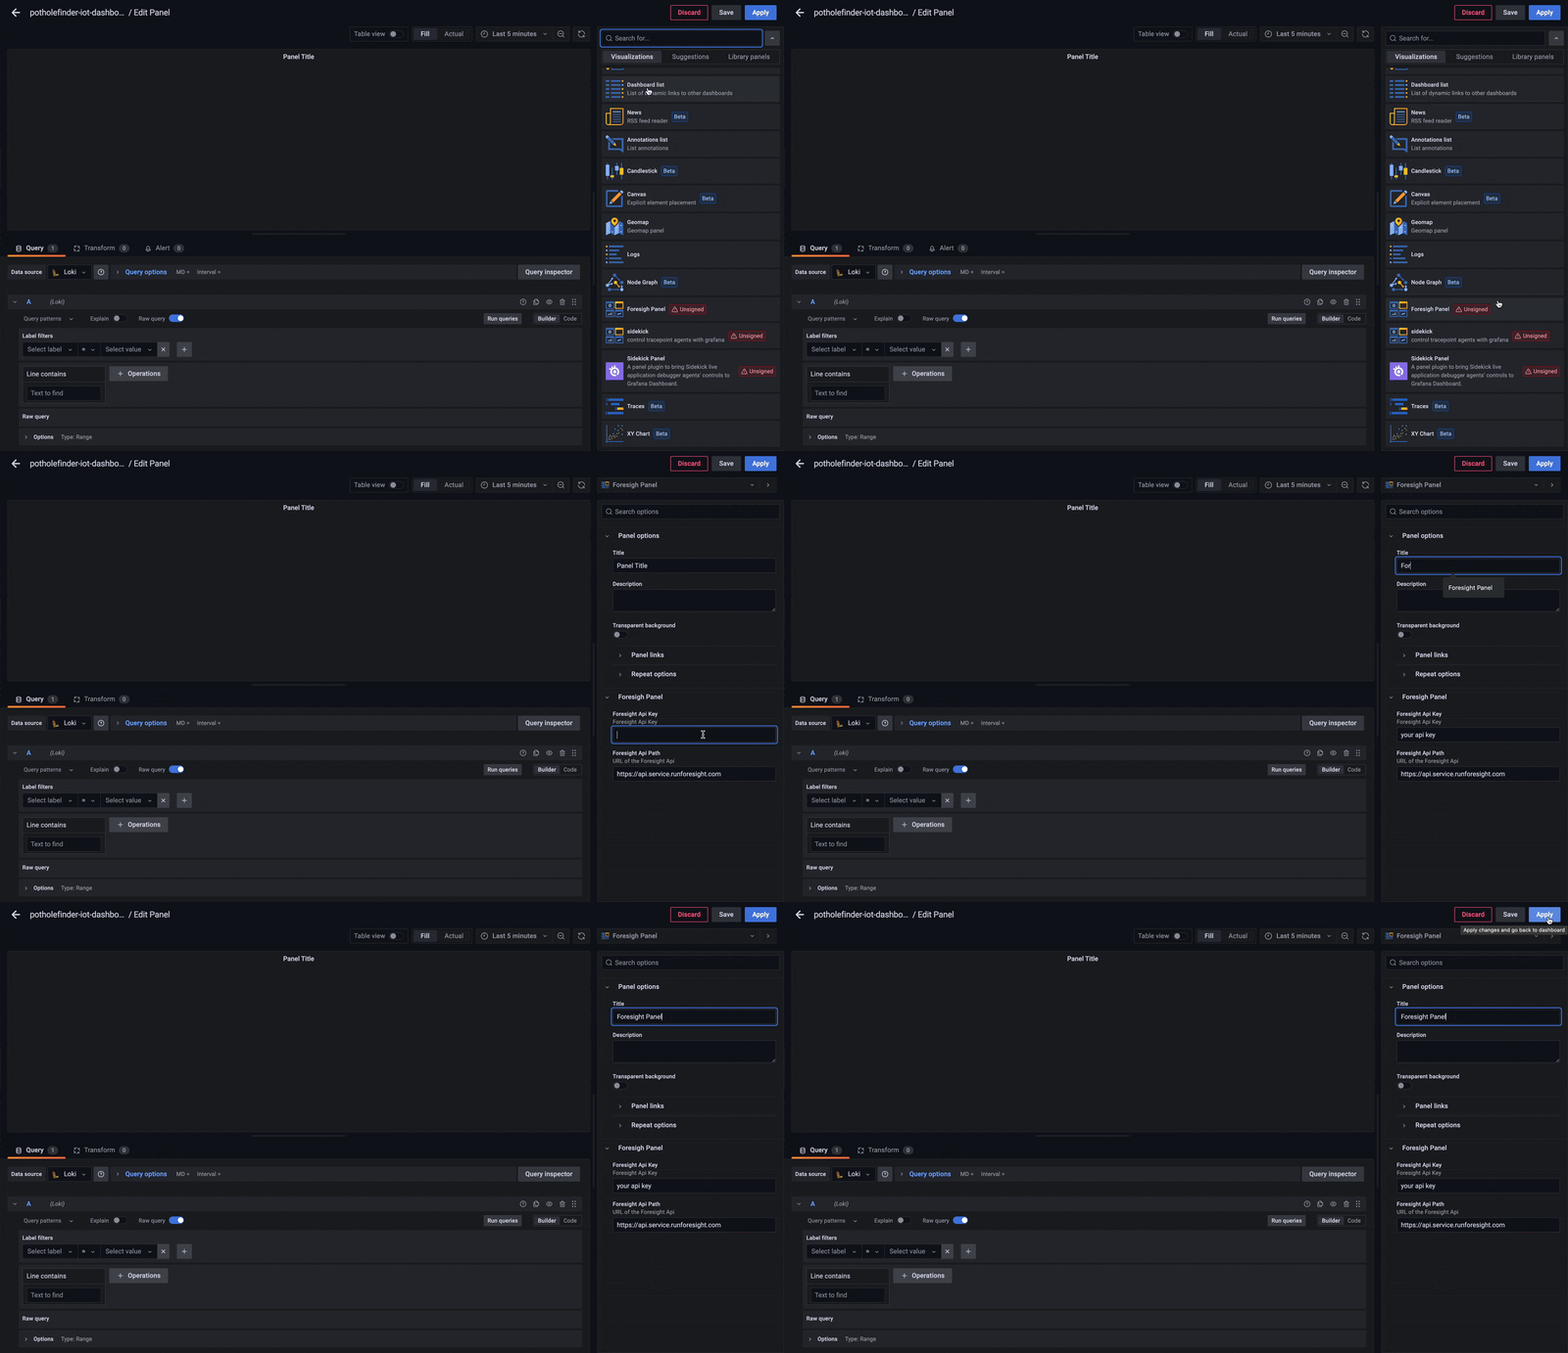
Add Foresight panel to Grafana Dashboard
Paste your API Key to Foresight API KEY field and you are good to go.